R-Group decomposition is available within the CDD Vault Visualization tool. The new “R” button is located in the available Plots section across the top of Visualization. Users can select one of the SuperSAR fragments or draw a “core” and then visualize the R-group substituents for the Molecules in the table containing that core. Selecting a core from the list of fragments:
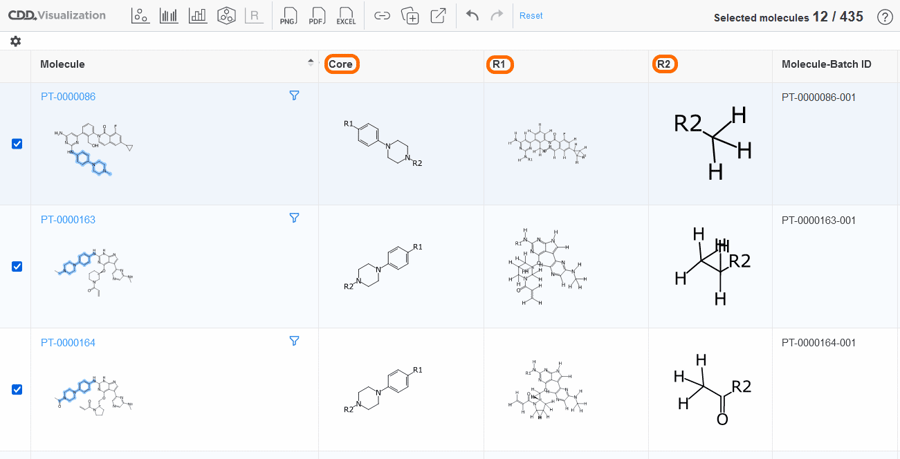
Drawing a core by launching the Structure Editor:
Once the plot displays, assign additional parameters, such as biological activity, to color, shape and size so users can examine the structure-activity relationships (SAR). The core and substituents for each molecule are automatically added to the data table. Use the color coding options for each additional column to explore your data tabularly.
Searches with Protocol Criteria are Faster
When searching for a specific Protocol or a Protocol with hit criteria, we've optimized the backend query so you should see results sooner. Helpful hint: Remember to use the Protocol default display options so only relevant data columns are returned.