June 17, 2022
New Interface Utilizing the Full Width of your Browser
The layout of CDD Vault has been updated to make better use of wide screens. The sidebar remains fixed-width which makes transitions smooth.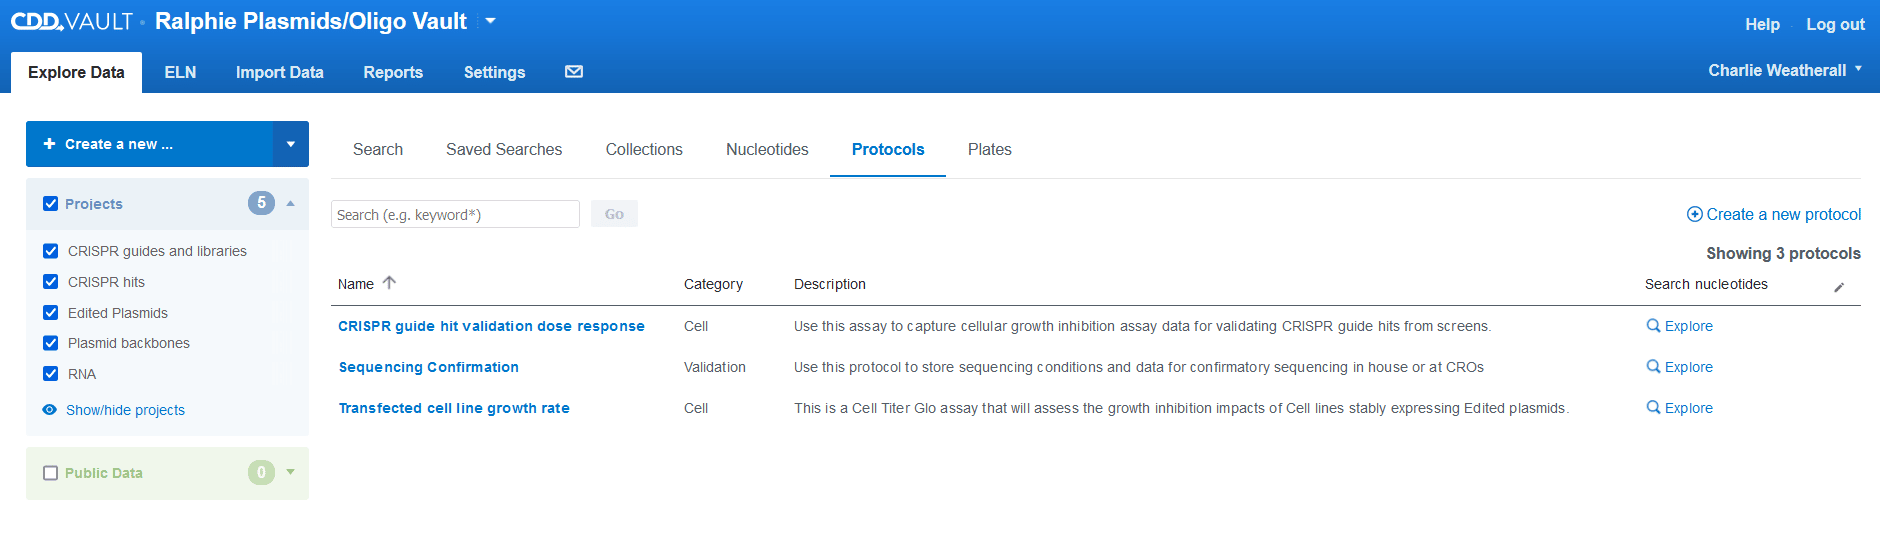 We will further polish this look over the coming weeks, and longer term we will be upgrading our frontend technologies for a more consistent and updated look and feel across the entire application. As always, let us know your thoughts and how we can enhance this further moving forward.
Visualize your Date Fields
Batch and Run dates can now be used for plotting and charting data in the CDD Vault Visualization interface.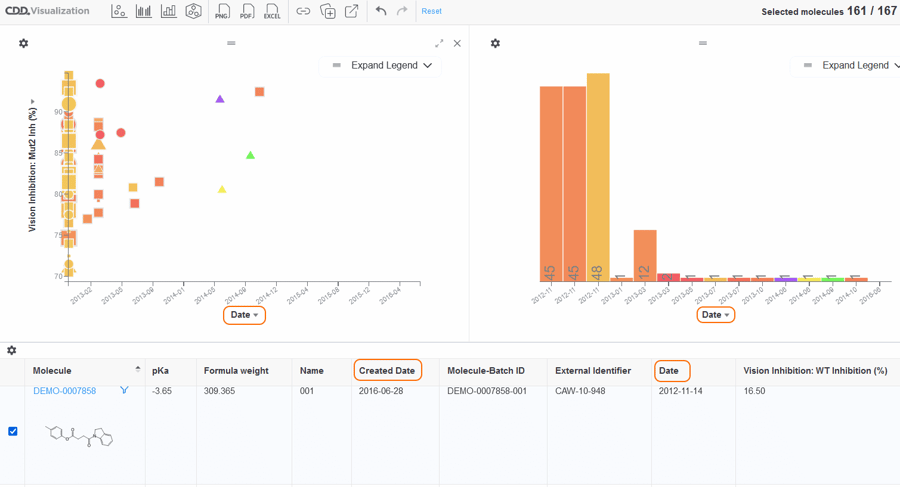 Note: Date properties cannot be used in Bar Charts. Molecule based date fields will be available soon.
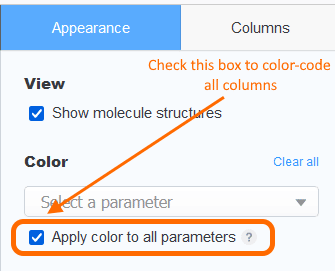
Color Code your Entire Data Table in One Click
Easily color code all columns within your data table in the CDD Vault Visualization interface. The option is available in the data table Settings panel.