Hello, CDD Vault users! I am happy to tell you about a new, modern GUI for creating Protocol readout definitions which will be deployed in about a week. This new technology lays an important foundation for the upcoming Curve Analytics module.
The biggest change is that dose-response calculations are now built in steps: create your concentration and response readout definitions first, then create a plot readout definition and select your X and Y inputs. This modularity gives you more flexibility and power in how your data is processed.
It’s important to note that all of the current functionality is preserved in the new workflow using the updated interface. To access new features, like the ability to feed calculated values into the plot or normalize calculated values, please reach out to your account manager to enable the Curve Analytics module.
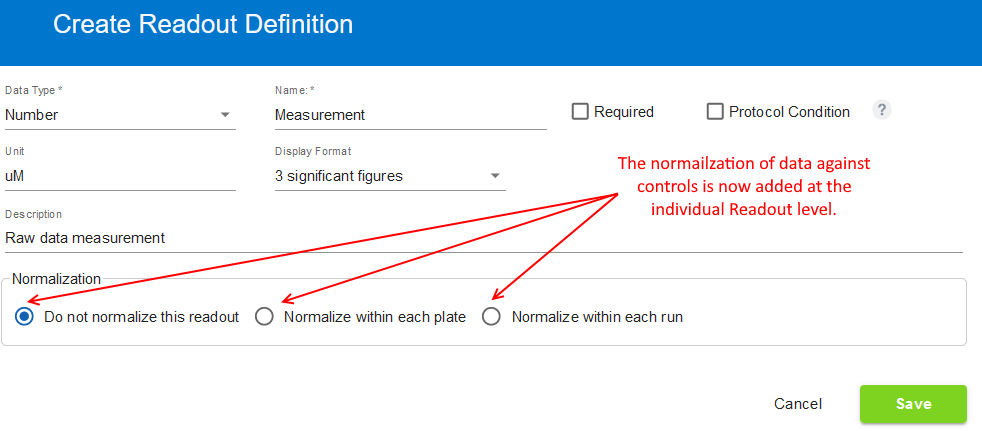
To create a new readout definition for any data type, simply use the “Create a new readout definition” link in the top-right corner. The options for each data type have not changed and normalizations can be found in a separate section at the bottom of the Number and Calculation based forms.

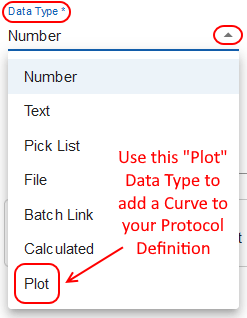
To add a Dose-Response curve to your Protocol, simply select the new “Plot” option under Data Type.

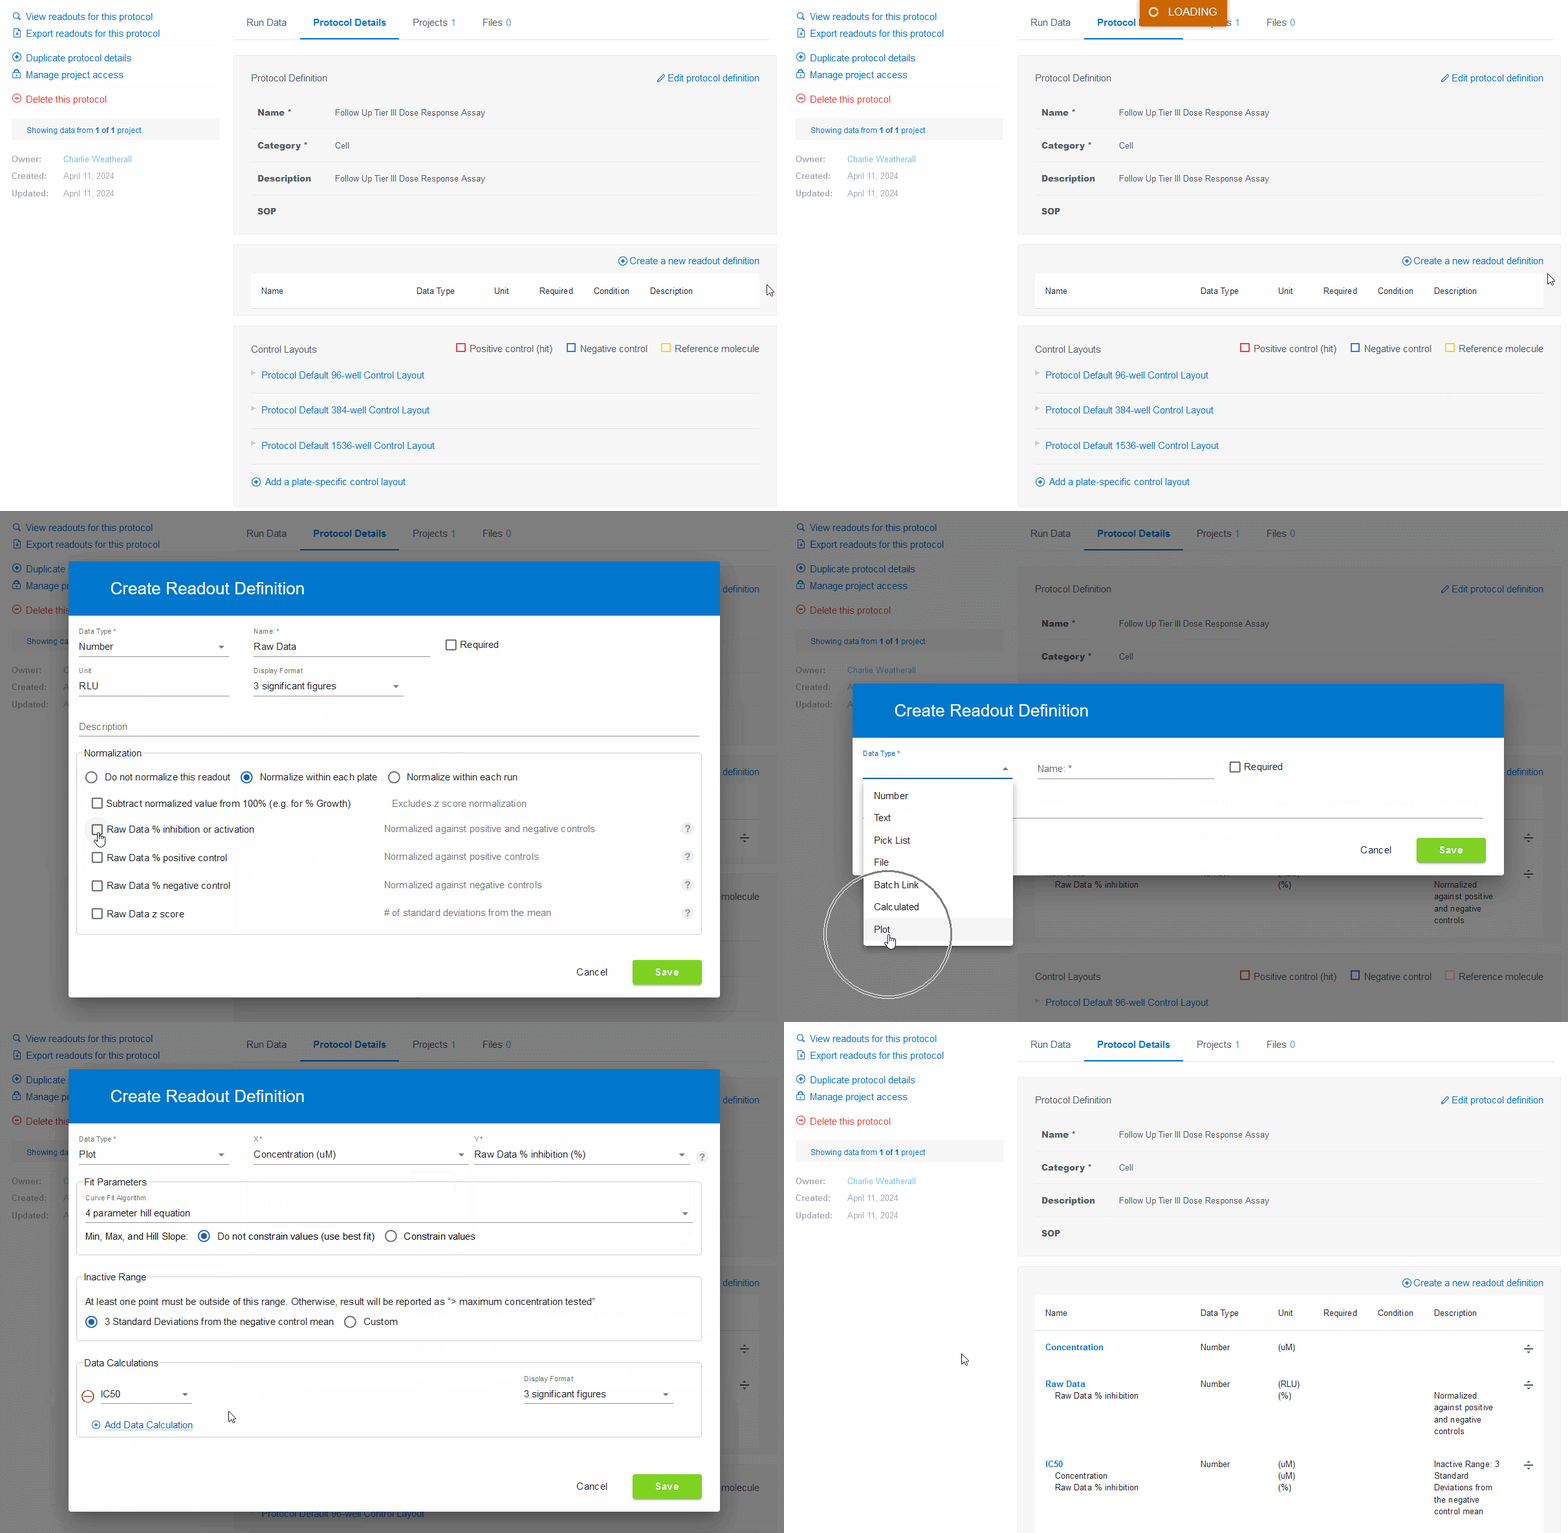
With the new modern interface, creating a Protocol for handling dose-response data follows these basic steps:
- Create a number-type readout definition for your Concentration values.
- Create a number-type readout definition for your Raw Data values, and select the appropriate normalization option.
- Create a plot-type readout definition for the dose-response curve:
- use your Concentration Readout as the x axis, and
- use the normalized Raw Rata % Inhibition (for example) value as the y axis (if you choose to normalize the raw data Readout).

To ensure existing Protocols remain compatible with this new architecture, readout definitions are automatically converted to use this new interface so you will see explicit readout definitions for your x and y inputs. This will, in no way, modify any Runs nor data associated with the existing readout definitions.
CDD Support is always happy to schedule a working session to review these, or any other features in CDD Vault. Please contact support@collaborativedrug.com with any questions you may have or to schedule a tour..
If this Vault Snack leaves you hungry for more, all previous Vault Snacks can be found here and as always, feel free to contact CDD Support — we are available to help you succeed in using CDD Vault.
Other posts you might be interested in
View All Posts
CDD Blog
3 min
April 14, 2025
Let’s Talk Security - Why a Bug Bounty May Be More Valuable Than a Penetration Test
Read More
CDD Vault Updates
7 min
April 10, 2025
CDD Vault Update (April 2025): Biphasic Curve Fit, Import Parser Sections, Custom Calculation Functions, Generate Inventory Labels, Inventory Admin Permission
Read More
CDD Blog
9 min
April 8, 2025
Drug Discovery Industry Roundup with Barry Bunin — April 8th, 2025
Read More


