

September 23, 2024
New Default ELN Editor:
The new ELN editor that had been pre-released for testing is now the default editor for all newly created entries. You can continue to edit entries created with the previous editor, but new features will only be available in the new editor. Existing entries that are duplicated will continue to use the old editor. We recommend copying contents over to a new entry and taking advantage of the new templates feature.
AUC calculation:
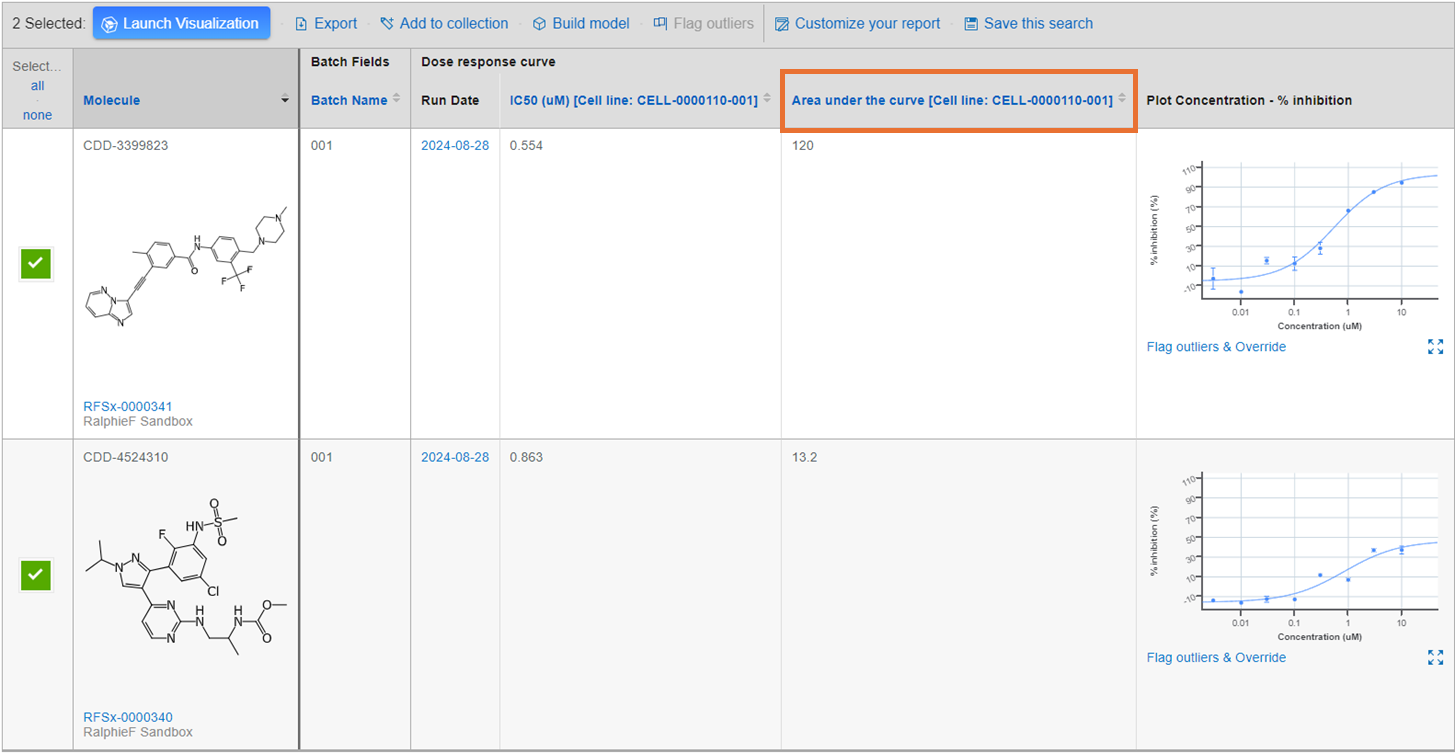
Area Under the Curve is now available as a default calculated parameter on all dose response (Hill Equation) protocols. AUC represents the total response of a system to varying levels of a drug or treatment and can serve as a powerful curve quality control metric.
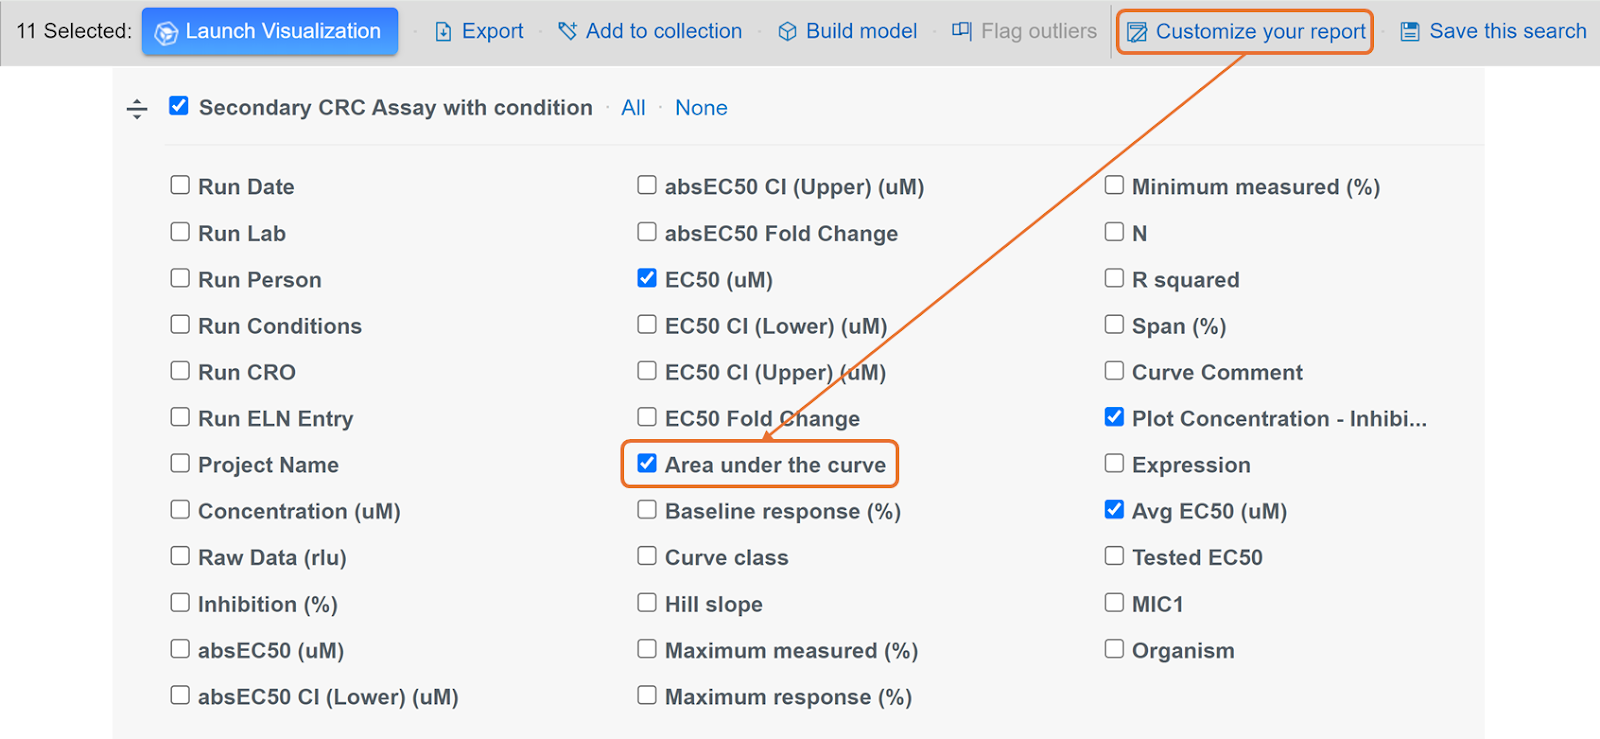
In order to view the AUC calculation, simply customize your search report and select ‘Area under the curve’ from your dose response curve readout definition options.
For all newly imported dose response data, the AUC will populate automatically. For existing data, you must trigger a recalculation which will populate the data and update the protocol and run modified dates. This can be easily accomplished by adding a fit parameter (slope =1) in the plot readout definition and then removing it. Please contact support if you want all protocols to be recalculated.
The CDD Vault AUC is calculated as the (positive area - negative area) under the dose response curve where:
- The curve is defined as straight line connections between responses, not the fitted curve
- Units are (response units * log_10(dose_units))
- The baseline is set at the negative control mean or 0 if control data is not available
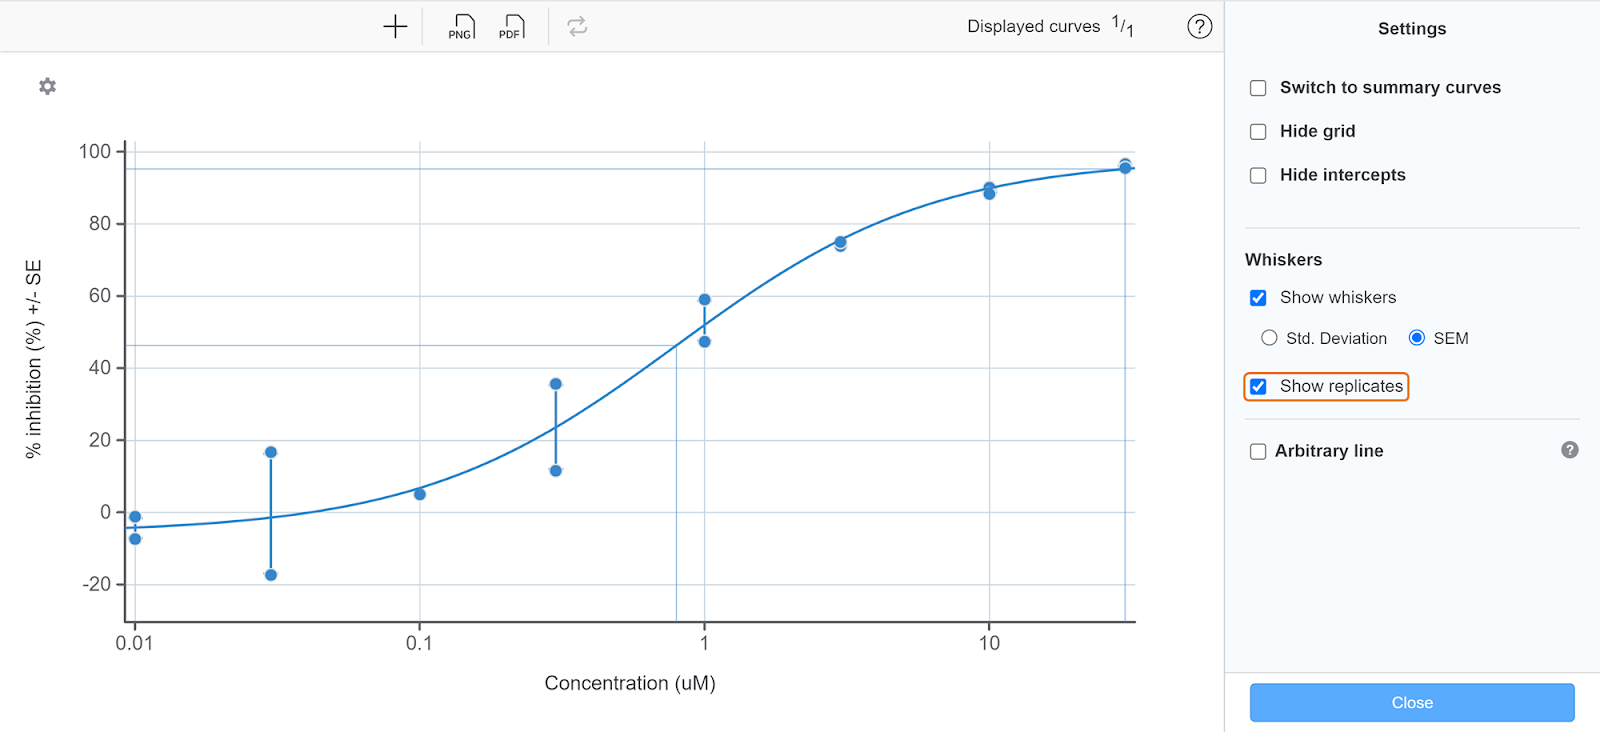
Show Replicates on Curves:
Display individual replicate points instead of a single averaged point. Whiskers can be toggled independently so it’s easy to see the distribution of points relative to the error bar range.
For assistance, questions, or to schedule a demo, please contact support@collaborativedrug.com.
This blog is authored by members of the CDD Vault community. CDD Vault is a hosted drug discovery informatics platform that securely manages both private and external biological and chemical data. It provides core functionality including chemical registration, data visualization, inventory, and electronic lab notebook capabilities.