May 2, 2023
CDD Vault Update (May 2023): CDD Vault Visualization Enhancements, Mapping Templates to Import Mixtures and Easily Copy Molfiles
Visualization: Highlight/Star Your Favorite Molecules
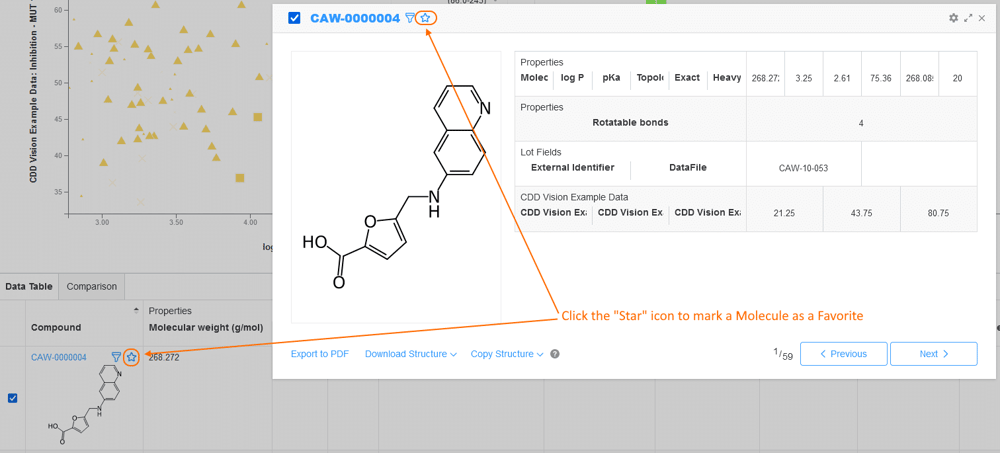
Users may now select/star “favorite” Molecules in a CDD Vault Visualization session.

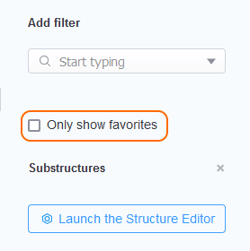
Toggle the filter in the sidebar and these “favorite” Molecules will be highlighted in all of your plots and tables. Easily compare records without filtering out your entire set.

Visualization: Manipulate the Arbitrary Line
An arbitrary line added to a scatterplot can now be freely manipulated within the plot. A new line will automatically appear with a small offset from the linear regression. Click anywhere on the line and it becomes interactive: drag, rotate, and shift directly on the plot.
Visualization: Select/Deselect All in Lists
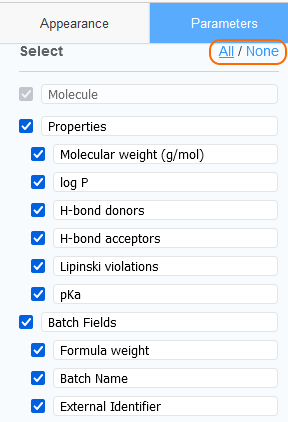
When customizing your list of parameters to display within Visualization, there are now buttons to Select All or None. This same option is available when calculation properties.

Visualization: Export Molecule pop-up to PDF
When you click on an ID or a chemical structure in Visualization, a Molecule pop-up is shown. Configure the display to group fields together across tables and then export to a PDF.
Mapping Templates to Import Mixtures
As with other entity types, users may now save Mapping Templates when composing new Mixtures in the Import Data tab. Once you compose your mixture, click the preview button and scroll to the bottom to save your template. The use of mapping templates greatly improves the efficiency of importing entities, and this now includes importing new Mixtures.
Molfile Option on Molecule Pop-Up
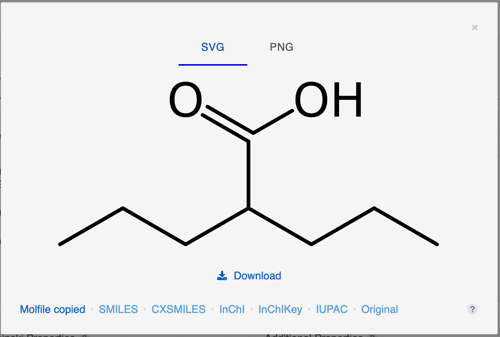
When clicking on a structure (in the Search Results Table, Molecules Overview tab, etc), there is a new Molfile option to easily copy the chemical representation. Molfiles preserve all structural information and should be used whenever possible. Click any one of the formats to copy that string to your clipboard.

Other posts you might be interested in
View All Posts
CDD Blog
3 min
April 14, 2025
Let’s Talk Security - Why a Bug Bounty May Be More Valuable Than a Penetration Test
Read More
CDD Vault Updates
7 min
April 10, 2025
CDD Vault Update (April 2025): Biphasic Curve Fit, Import Parser Sections, Custom Calculation Functions, Generate Inventory Labels, Inventory Admin Permission
Read More
CDD Blog
9 min
April 8, 2025
Drug Discovery Industry Roundup with Barry Bunin — April 8th, 2025
Read More


