December 5, 2022
CDD Vault Update (December 2022): Add Statistical Lines to Visualization Plots and a Reminder on New Chemistry Features
Add Statistical Lines to Visualization Plots
The ability to add statistical lines into Visualization plots is now available. Easily add lines for linear regression, Means, Medians, Standard Deviations and even an arbitrary line to Visualization plots.
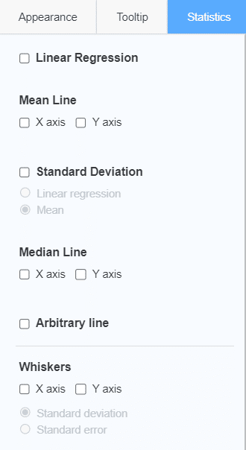
The Statistics tab within the Plot Configuration menu now provides a variety of options for annotating your plots.New Chemistry Features in CDD Vault
As previously mentioned in an email to Vault Administrators, the CDD Development team has begun the new CDD chemistry rollout. You can always see which chemistry version is currently enabled in your Vault by checking the webpage footer. The very bottom of each CDD Vault webpage will indicate if you are "Using CDD chemistry" versus "Using legacy chemistry". As always, please let us know if you have any feedback.Other posts you might be interested in
View All Posts
CDD Vault Updates
3 min
April 14, 2023
CDD Vault Update (April 2023): Cluster Analysis, Substructures as Parameters, Search filters in Visualization, and a Tautomer Parameter for the API
Read More
CDD Vault Updates
1 min
August 25, 2022
CDD Vault Update (August 2022[#3]): R-Group Decomposition and Faster Protocol Searches
Read More
CDD Vault Updates
1 min
September 2, 2025
CDD Vault Update (September 2025): Plot replicate values in CDD Visualization
Read More

