

April 18, 2025
We are excited to announce a new round of features associated with our Curves add-on. If you are not yet subscribed to Curves, please contact your CDD Vault account manager or the CDD Vault Support Team to discuss enabling these features in your CDD Vault.
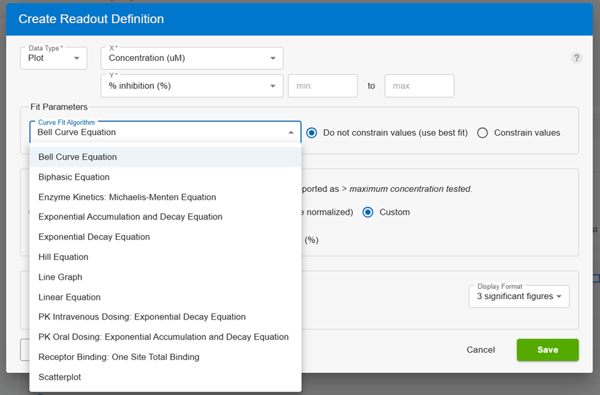
Researchers have requested Pharmacokinetic (PK) and Michaelis-Menten Kinetics (Km/Kd) curve fits, CDD Vault Administrators now can enable these new equations by navigating to the Settings > Vault > Plots page. Once the curve fit type is enabled, the PK, Km, or Kd equation can be used in a ‘Plot’ protocol readout definition instead of the standard Hill Equation.
PK Oral Dosing: Exponential Accumulation and Decay Curve Fit
CDD Vault will automatically calculate the parameters below from imported data using the following equation:

- C - amplitude
- Cmax - highest measured concentration after the absorption phase
- Cmin - lowest measured concentration after the elimination phase
- Ka - absorption phase rate constant
- Ke - elimination phase rate constant
- T½ - half-life (ln(2)/Ke)
- Tmax - time where Cmax is reached
- AUC - area under curve in observed interval (0, t)
- AUCt-inf - extrapolated AUC after last measurement (Cmin (1/Ke - 1/Ka))
- AUC0-inf - extrapolated total area under the curve (AUC + AUCt-inf)
- N - total number of data points used to perform the curve fit
- Maximum measured - Maximum extremal value of all measured responses
- Minimum measured - Minimum extremal value of all measured responses
- R-squared - quality of fit

PK Intravenous Dosing: Exponential Decay Equation
CDD Vault will automatically calculate the parameters below from imported data using the following equation:![]()
- C0 - concentration at zero time
- Cmin - concentration at infinite time
- Ke - elimination rate constant
- T1/2 - half-life (ln(2)/Ke)
- Tau - mean life time (1/Ke)
- AUC - area under curve in observed interval (0, t)
- AUCt-inf - extrapolated AUC after last measurement (Cmin / Ke)
- AUC0-inf - extrapolated total area under the curve (AUC + AUCt-inf)
- Plateau = Cmin
- Span - C0 - Cmin
- N - total number of data points used to perform the curve fit
- R-squared

Enzyme Kinetics: Michaelis-Menten Equation (Km)
CDD Vault will automatically calculate the parameters below from imported data using the following equation:![]()
- Vmax
- Km
- Maximum measured - Maximum extremal value of all measured responses
- Minimum measured - Minimum extremal value of all measured responses
- N - total number of data points used to perform the curve fit
- R squared
- AUC - area under curve in observed range

Receptor binding: one site total binding curve fit (Kd)
CDD Vault will automatically calculate the parameters below from imported data using the following equation:
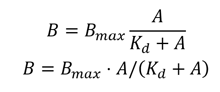
- Bmax
- Kd
- Maximum measured - Maximum extremal value of all measured responses
- Minimum measured - Minimum extremal value of all measured responses
- N - total number of data points used to perform the curve fit
- R squared
- AUC - area under curve in observed range

These pharmacokinetic and enzyme equations are the latest addition to CDD Vault Curves add-on. You can select these in Plots together with the other recently added equations as described in the CDD Vault Support online documentation and below for convenience:
Use the CDD Vault Curves feature to generate, QC, and analyze results in CDD Vault. This streamlines data processing and allows users to express complex trends in a concise manner. Once Curves are enabled for a Vault (contact CDD Support), the available curves (algorithms) are selectable at the Vault level. There is also an option to allow users to add Curve Comments to their plots.
CDD Vault Administrators can enable various Curve types as well as Curve Comments using the Settings > Vault > Plots tab. To edit or add Curve types and/or Curve Comments, CDD Vault Administrators can navigate to the Settings > Vault > Plots tab and click the “Edit plots settings” link (the pencil icon) located in the top right of this panel.

Users can then choose the Plot type they desire for their Protocol definitions:
Donut Chart
In CDD Vault’s Visualization app, utilize a donut chart to display groupings of molecules. Set the parameter for the donut chart using the label below the donut.

TIFF Image Previews in ELN
When you attach Tagged Image File Format (.tif/.tiff) files to an ELN entry you will now see a thumbnail. Clicking on the thumbnail will show a preview that can be zoomed in or out. Expand or contract the thumbnail image displayed in the entry.

Stoichiometry Tables for Parallel Reactions
Parallel synthesis work can now be captured directly in the ELN. Insert a reaction using R groups to depict variable sites on reagents and products. Common reagents can be added manually to the table or included into the reaction scheme. Reagent/product pairs are added at the bottom of the stoichiometry table. Each pair can be drawn manually or uploaded via an Excel (xlsx) or CSV file as SMILES. The table is limited to 10 reagent/product pairs.
 To provide feedback on features, or if you have questions and want to schedule a demo, please contact support@collaborativedrug.com.